CA: Orthopedist Bill Denial Rates by Claims Admin - Part 3

In the first two of this series (read here and here), daisyData from orthopedic surgeon clients highlights how California’s convoluted Medical Provider Network (MPN) system enables claims administrators to siphon significant portions of the reimbursements owed to these specialists.
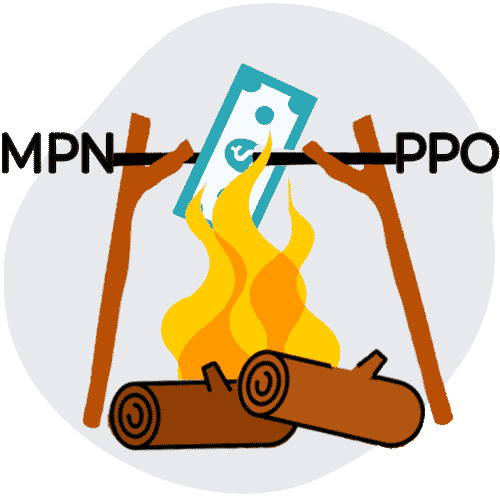
Claims administrators in California force orthopedic surgeons into unfavorable discounted reimbursement agreements by linking MPN membership to Preferred Provider Organizations (PPOs). This tangled MPN/PPO system benefits claims administrators and private equity owners at the expense of the orthopedic surgeons who care for California’s injured workers.
Data from daisyBill reveals that orthopedic surgeons collectively received reimbursements averaging only 109% of Medicare rates from 2022 to 2024—despite California setting its Official Medical Fee Schedule (OMFS) to reimburse orthopedic surgeons at 134% of Medicare in 2022, 143% of Medicare in 2023, and 146% in 2024.
Additionally, reimbursement data from 117 claims administrators show how many fail to reimburse orthopedic surgeons adequately. For example, the State Compensation Insurance Fund (CA) collectively paid orthopedists at 90% of the Medicare rate.
Today, we focus on the rates at which claims administrators deny orthopedic surgeons’ bills. This denial data underscores the extent to which claims administrators benefit from California’s payer-friendly laws and enforcement. It raises concerns that such a system incentivizes these administrators to deny payments, whether the reasons are legitimate or not.
On average, claims administrators denied 9% of bills submitted by California orthopedists, resulting in $0 payments. However, denial rates vary significantly. For instance, Employers Compensation Insurance Company denied 33% of original bills (“initial bills"). At the same time, the Department of Labor (DOL), which administers claims for federal employees, had a much lower denial rate of 8%. Unlike California claims administrators, the DOL is self-administered and not financially motivated to deny bills.
Correcting these denials is both burdensome and costly for providers. They must submit a Second Review appeal and potentially request an Independent Bill Review (IBR), which costs $180. Failure to follow the mandated appeal steps promptly and properly results in the provider forfeiting the amount owed, even if the reason for the denial is false or invalid.
The harsh truth is that injured workers are increasingly unable to find orthopedists for treatment because California’s laws and regulatory environment have enabled claims administrators to turn treating these patients into a low-paying crapshoot and a significant administrative nightmare.
Second Review Appeals
To dispute an incorrect bill payment denial places is an extraordinary administrative burden for an orthopedist’s administrative staff:
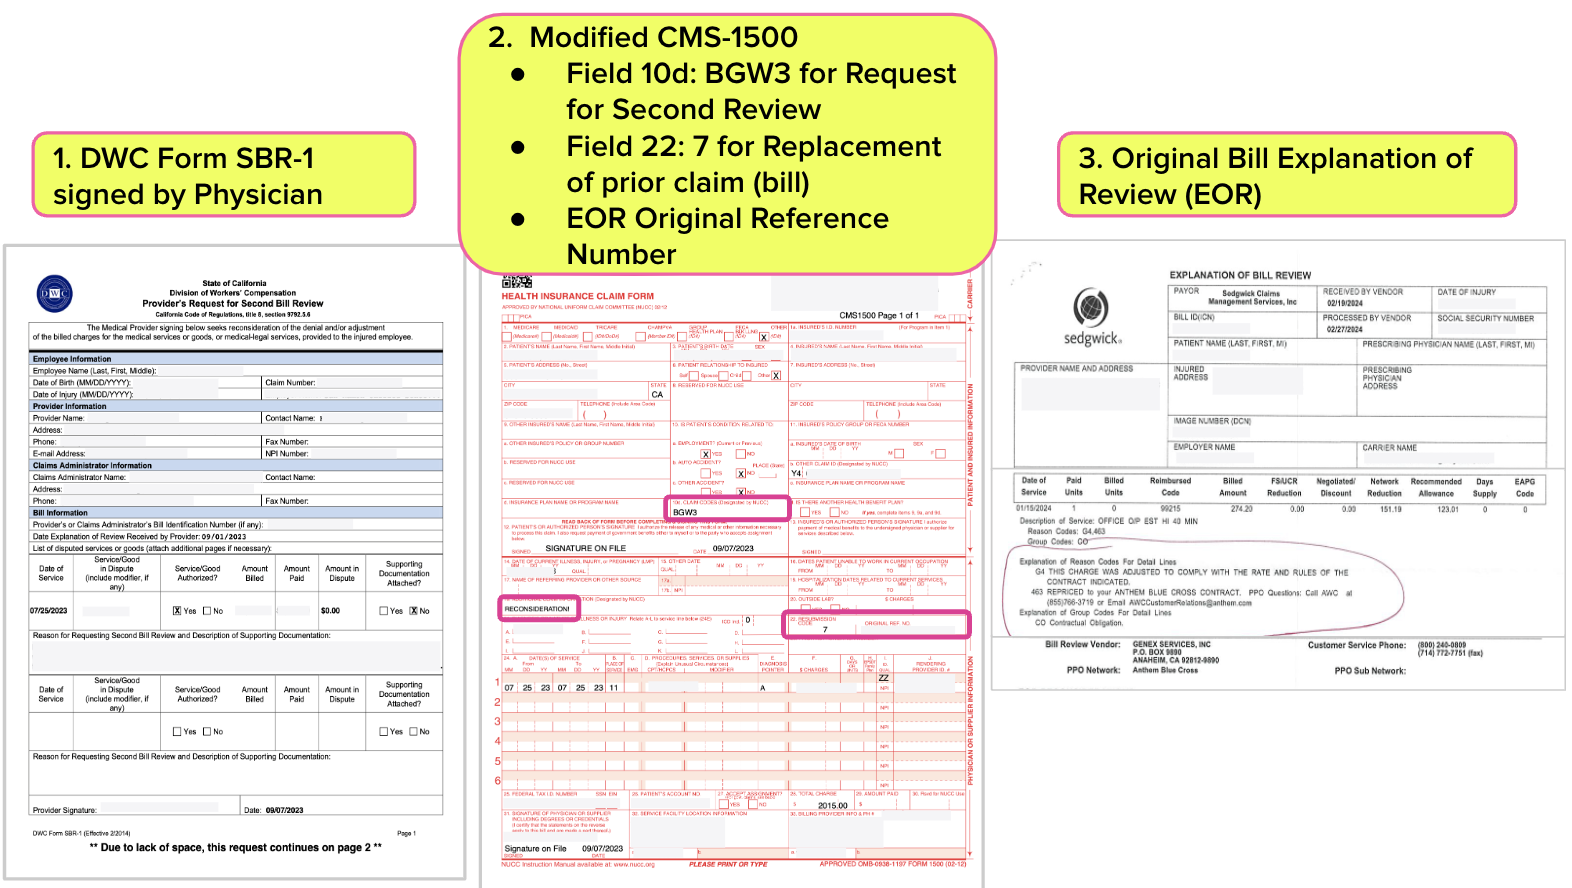
- The staff must submit a Second Review appeal within 90 days from the date of service of the Explanation of Review (EOR) that denied or underpaid the initial bill. Failure to meet this deadline forfeits the provider's right to appeal further.
- The appeal must be submitted using the DWC Form SBR-1.
- The CMS-1500 billing form must include specific codes to indicate it is a Second Review appeal. Code 'BGW3' is entered in box 10d to signal a Second Review appeal, and code '7' for "Replacement of prior claim (bill)" is entered in box 22 along with the original reference number.
- The Explanation of Review (EOR) must be sent with the DWC Form SBR-1.
- The appeal must be submitted in the same manner as the original (initial) bill.
When providers fail to adhere to all the requirements for Second Review appeals, the California Division of Workers' Compensation (DWC) can deny the appeal on technicalities, effectively siding with claims administrators. For instance, if a provider omits a necessary element, such as a signature on the Second Review appeal form, the DWC may rule the dispute ineligible for Independent Bill Review (IBR).
Some claims administrators, such as Sedgwick, systematically ignore or improperly deny Second Review appeals, leaving providers with no recourse but to accept incorrect reimbursements or pay $180 to request IBR—an even more administratively arduous process.
Bill Payment Denial Rates for CA Orthopedic Bills
Below, we present the bill payment denial data from orthopedists as follows:
- 285 orthopedists (identified by taxonomy code)
- 155 practices (identified by FEIN)
- Dates of Service 1/1/2022 through 6/30/2024
- 433,714 original treatment bills (non-medical-legal bills)
- 74 claims administrators that received at least 500 bills
daisyData shows claims administrators denied bill payment for over 39,000 or 9% of orthopedists' bills.
The first table below lists the 20 claims administrators with the most significant bill payment denial counts and the percentage of original bills denied.
1. Top 20 Claims Administrators With Largest Count of Denied Bills
Claims Administrator |
Original Bill Count |
Original Bill Denial Count |
Original Bill Denial % |
Sedgwick Claims Management Services, Inc. |
111,144 |
7,780 |
7% |
Gallagher Bassett Services Inc. |
31,210 |
3,805 |
12% |
State Compensation Insurance Fund (CA) |
27,843 |
2,788 |
10% |
CorVel |
18,561 |
2,140 |
12% |
Intercare Holdings Insurance Services, Inc. |
15,130 |
1,644 |
11% |
Employers Compensation Insurance Company |
4,703 |
1,560 |
33% |
ESIS, Inc. |
16,648 |
1,434 |
9% |
Zurich Insurance North America |
10,705 |
1,387 |
13% |
The Hartford |
6,140 |
1,328 |
22% |
Travelers |
10,670 |
1,112 |
10% |
Department of Labor |
13,349 |
1,027 |
8% |
Liberty Mutual Insurance |
13,414 |
965 |
7% |
Insurance Company of the West |
8,345 |
957 |
11% |
AmTrust North America, Inc. |
8,419 |
935 |
11% |
Next Level Administrators |
2,747 |
667 |
24% |
Keenan & Associates |
7,784 |
640 |
8% |
Berkshire Hathaway Homestate Companies |
7,720 |
619 |
8% |
Cannon Cochran Management Services, Inc. |
7,219 |
495 |
7% |
Broadspire Services, Inc. |
8,903 |
488 |
5% |
Chubb Group of Insurance Companies |
2,952 |
476 |
16% |
The second table below lists all 74 claims administrators sorted in descending order by the percentage of Original Bills denied. Compared to the Department of Labor’s 8% denial rate, the data reveals the many claims administrators with a glaring penchant for refusing to pay their bills.
Remember, if a provider fails to adhere to the stringent Second Review and IBR processes required to dispute these bill payment denials, the claims administrator retains the provider’s reimbursement.
While we cannot assign a motive to these high bill payment denial percentages, we can highlight that each denial is potentially very profitable for a claims administrator and its private equity owner(s).
2. All Claims Administrators Sorted Descending by Denial %
Claims Administrator |
Original Bill Count |
Original Bill Denial Count |
Original Bill Denial % |
Employers Compensation Insurance Company |
4,703 |
1,560 |
33% |
Next Level Administrators |
2,747 |
667 |
24% |
The Hartford |
6,140 |
1,328 |
22% |
Protective Insurance |
843 |
163 |
19% |
Strategic Comp |
835 |
153 |
18% |
AIG Claims, Inc. |
1,197 |
219 |
18% |
Guard Insurance Group |
1,662 |
302 |
18% |
Omaha National Group |
789 |
143 |
18% |
Preferred Employers Insurance Company |
2,025 |
334 |
16% |
Farmers Insurance |
2,063 |
340 |
16% |
Chubb Group of Insurance Companies |
2,952 |
476 |
16% |
Markel First Comp Insurance |
671 |
107 |
16% |
GuideOne Insurance |
641 |
96 |
15% |
Church Mutual Insurance Company |
516 |
74 |
14% |
Hanover Insurance Company |
585 |
80 |
14% |
Alaska National Insurance |
1,851 |
243 |
13% |
Zurich Insurance North America |
10,705 |
1,387 |
13% |
Gallagher Bassett Services Inc. |
31,210 |
3,805 |
12% |
Barrett Business Services Inc. |
797 |
96 |
12% |
CorVel |
18,561 |
2,140 |
12% |
City of Los Angeles (CA) |
3,278 |
376 |
11% |
Insurance Company of the West |
8,345 |
957 |
11% |
Albertsons / Safeway / Vons |
1,134 |
130 |
11% |
CompWest Insurance Company |
2,915 |
333 |
11% |
AmTrust North America, Inc. |
8,419 |
935 |
11% |
American Claims Management, Inc |
1,504 |
167 |
11% |
Intercare Holdings Insurance Services, Inc. |
15,130 |
1,644 |
11% |
Travelers |
10,670 |
1,112 |
10% |
Crum & Forster |
808 |
83 |
10% |
CNA Insurance |
1,786 |
182 |
10% |
State Compensation Insurance Fund (CA) |
27,843 |
2,788 |
10% |
Sempra Energy Employee Care Services |
1,070 |
106 |
10% |
City and County of San Francisco (CA) |
2,452 |
237 |
10% |
Allianz |
683 |
65 |
10% |
American Equity Underwriters |
567 |
53 |
9% |
The Zenith |
3,137 |
288 |
9% |
Elite Claims Management, Inc. |
818 |
75 |
9% |
Midwest Insurance |
1,077 |
95 |
9% |
ESIS, Inc. |
16,648 |
1,434 |
9% |
Republic Indemnity |
2,912 |
245 |
8% |
Berkley Net Underwriters, LLC |
602 |
50 |
8% |
Keenan & Associates |
7,784 |
640 |
8% |
Berkshire Hathaway Homestate Companies |
7,720 |
619 |
8% |
Cottingham & Butler Claims Services, Inc. |
851 |
67 |
8% |
Helmsman Management Services LLC |
3,878 |
303 |
8% |
Department of Labor |
13,349 |
1,027 |
8% |
CopperPoint Mutual |
1,151 |
87 |
8% |
Beta Healthcare Group Risk Management Authority |
1,435 |
104 |
7% |
Liberty Mutual Insurance |
13,414 |
965 |
7% |
California Insurance Guarantee Association |
1,040 |
74 |
7% |
Sedgwick Claims Management Services, Inc. |
111,144 |
7,780 |
7% |
Cannon Cochran Management Services, Inc. |
7,219 |
495 |
7% |
Sentry Insurance |
3,605 |
228 |
6% |
Benchmark Administrators |
2,074 |
125 |
6% |
Pacific Compensation Insurance Company |
3,619 |
208 |
6% |
Broadspire Services, Inc. |
8,903 |
488 |
5% |
Southern California Edison |
640 |
35 |
5% |
Acclamation Insurance Management Services |
1,703 |
85 |
5% |
Sutter Health |
782 |
39 |
5% |
County of San Diego (CA) |
1,684 |
75 |
4% |
City of Los Angeles Department of Water and Power (CA) |
1,767 |
77 |
4% |
Athens Administrators |
8,592 |
371 |
4% |
LWP Claims Solutions, Inc. |
2,437 |
95 |
4% |
Tristar Risk Management |
5,781 |
211 |
4% |
Adminsure, Inc. |
5,595 |
187 |
3% |
County of Riverside (CA) |
903 |
27 |
3% |
Marriott Claims Service Corp |
1,281 |
36 |
3% |
Self-Insured Schools of California (CA) |
859 |
23 |
3% |
National Interstate Insurance |
517 |
11 |
2% |
Nassco / General Dynamics |
902 |
18 |
2% |
City of San Diego (CA) |
5,975 |
101 |
2% |
Los Angeles County Metropolitan Transit Authority (CA) |
1,671 |
22 |
1% |
AmeriTrust Group, Inc. |
620 |
6 |
1% |
The Walt Disney Company |
1,528 |
11 |
1% |
Totals |
433,714 |
39,708 |
9% |
daisyBill keeps track of what you’re paid—and when you’re not, so you can take corrective action. Schedule a free demo below.
SCHEDULE DEMO


DaisyBill provides content as an insightful service to its readers and clients. It does not offer legal advice and cannot guarantee the accuracy or suitability of its content for a particular purpose.