Data: Duplicate Bill Rates by Claims Administrator

Data don’t lie — and the data clearly demonstrate that for workers’ comp providers, sending bills electronically (as e-bills) means sending far fewer duplicate bills (which also means faster payment).
Providers must submit duplicate bills when the claims administrator does not respond to a bill, or reports that the bill is “not on file.”
When a claims administrator timely responds to providers’ bills, there is rarely a need to send duplicates. Therefore, a high rate of duplicate bills indicates that the claims administrator may be needlessly forcing providers to expend excessive time and administrative resources to obtain reimbursement.
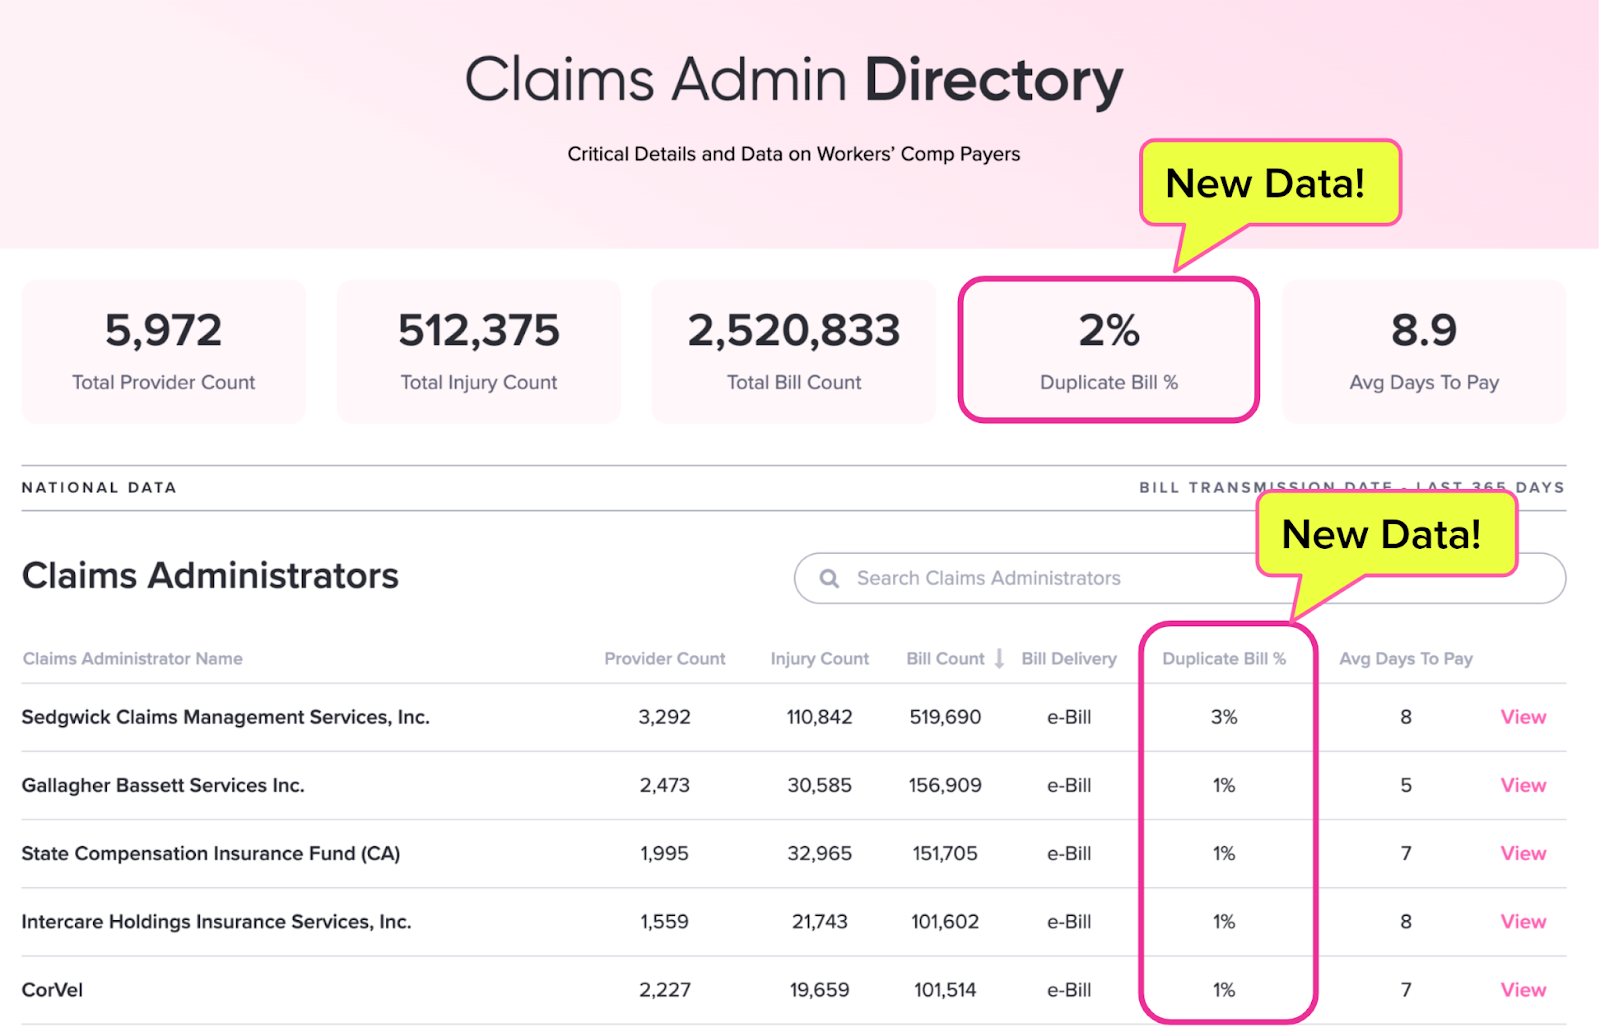
Now, daisyBill’s Claims Administrator Directory publishes the rates at which our provider clients must submit duplicate bills to each claims administrator. Read on for details!
Tracking Bills and Duplicates
For workers’ comp bills daisyBill providers sent in the preceding 365 days, the Claims Administrator Directory now lists the following duplicate bill data:
- The total duplicate bill percentage for all claims administrators (e.g., 2% of the 2.5 million bills providers sent as of this writing were duplicates)
- The percentage of duplicate bills sent to each claims administrator
Duplicate Data: Top Claims Administrator By Bill Volume
Below, we list the 25 claims administrators to which daisyBill providers sent the most bills in the last 365 days. In that time, daisyBill providers sent these claims administrators over 1.9 million e-bills, representing 78% of the 2.5 million bills.
All of the claims administrators listed below accept e-bills from daisyBill. The list is sorted in ascending order according to the percentage of duplicate bills providers had to send the claims administrator.
Note the performance of Next Level Administrators and The Zenith, which both have a 0% duplicate bill rate. Statistically, our providers never have to send duplicate bills to these two claims administrators. Next Level and Zenith are to be commended for making it easier for providers to treat injured workers.
These data demonstrate that when e-bills are correctly delivered to a claims administrator, the duplicate bill percentage and the average days to payment are astoundingly low.
Claims Administrator Name |
Provider Count |
Injury Count |
Bill Count |
Bill Delivery |
Duplicate Bill % |
Avg Days To Pay |
Next Level Administrators |
1,082 |
4,759 |
24,951 |
e-Bill |
0% |
9 |
The Zenith |
920 |
5,252 |
22,862 |
e-Bill |
0% |
8 |
Gallagher Bassett Services Inc. |
2,473 |
30,585 |
156,909 |
e-Bill |
1% |
5 |
State Compensation Insurance Fund (CA) |
1,995 |
32,965 |
151,705 |
e-Bill |
1% |
7 |
Intercare Holdings Insurance Services, Inc. |
1,559 |
21,743 |
101,602 |
e-Bill |
1% |
8 |
CorVel |
2,227 |
19,659 |
101,514 |
e-Bill |
1% |
7 |
Liberty Mutual Insurance |
1,964 |
17,112 |
80,938 |
e-Bill |
1% |
6 |
Travelers |
2,113 |
16,877 |
76,511 |
e-Bill |
1% |
5 |
AmTrust North America, Inc. |
1,946 |
13,887 |
69,149 |
e-Bill |
1% |
7 |
Zurich Insurance North America |
1,796 |
12,039 |
68,673 |
e-Bill |
1% |
9 |
Insurance Company of the West |
1,420 |
11,073 |
54,434 |
e-Bill |
1% |
8 |
Keenan & Associates |
1,102 |
6,511 |
32,357 |
e-Bill |
1% |
12 |
Helmsman Management Services LLC |
1,227 |
4,796 |
22,765 |
e-Bill |
1% |
6 |
Berkshire Hathaway Homestate Companies |
2,629 |
14,577 |
71,523 |
e-Bill |
2% |
11 |
Cannon Cochran Management Services, Inc. |
1,981 |
11,079 |
54,747 |
e-Bill |
2% |
12 |
The Hartford |
1,899 |
10,274 |
54,620 |
e-Bill |
2% |
6 |
Athens Administrators |
1,602 |
11,617 |
54,238 |
e-Bill |
2% |
9 |
Broadspire Services, Inc. |
1,777 |
10,379 |
54,041 |
e-Bill |
2% |
10 |
Department of Labor |
692 |
3,998 |
25,333 |
e-Bill |
2% |
8 |
LWP Claims Solutions, Inc. |
1,149 |
4,424 |
22,998 |
e-Bill |
2% |
10 |
Sedgwick Claims Management Services, Inc. |
3,292 |
110,842 |
519,690 |
e-Bill |
3% |
8 |
ESIS, Inc. |
1,921 |
14,143 |
70,530 |
e-Bill |
3% |
9 |
Employers Compensation Insurance Company |
1,311 |
4,569 |
22,894 |
e-Bill |
4% |
5 |
Los Angeles County Metropolitan Transit Authority (CA) |
428 |
3,775 |
22,831 |
e-Bill |
6% |
13 |
Tristar Risk Management |
1,341 |
7,301 |
32,014 |
e-Bill |
11% |
16 |
Total Bill Count |
1,969,829 |
Unfortunately (but not surprisingly) Tristar has the worst performance on the list, with a whopping 11% duplicate bill percentage and the highest average days to payment at 16 days. By failing to process bills properly, Tristar makes treating injured workers difficult for providers.
Duplicate Data: Non-e-Billing Claims Administrators
Below is a list of the 20 claims administrators that do not accept e-bills, to which daisyBill providers sent the most bills in the last 365 days. daisyBill providers sent over 63,000 bills to these 20 claims administrators via fax or email.
Again the list is sorted in ascending order according to the duplicate bill percentage. To the surprise of no one, these claims administrators have significantly higher duplicate percentages and higher average days to payment than claims administrators that accept e-bills.
The good news: daisyBill sends over 92% of bills electronically as e-bills and only 7% via fax or email. Since most claims administrators compliantly accept and pay providers’ bills most of the time, and daisyBill delivers only clean, compliant bills, duplicate submissions represent only 2% of our providers’ total bills.
In other words, the duplicate percentages and average days to payment below are statistical outliers; we publish them only to demonstrate how inefficient billing becomes when claims administrators fail to accept e-bills.
Claims Administrator Name |
Provider Count |
Injury Count |
Bill Count |
Bill Delivery |
Duplicate Bill % |
Avg Days To Pay |
Pitman Farms |
13 |
143 |
469 |
0% |
18 |
|
The Cities Group |
51 |
118 |
733 |
Fax |
2% |
26 |
Subsequent Injuries Benefits Trust Fund (CA) |
122 |
1,064 |
2,364 |
4% |
30 |
|
Tribal First |
129 |
486 |
2,076 |
4% |
34 |
|
Contract Claims Services Inc. |
99 |
167 |
823 |
Fax |
4% |
18 |
Pacific Claims Management |
388 |
1,411 |
7,291 |
5% |
16 |
|
JT2 Integrated Resources* |
211 |
468 |
2,466 |
5% |
13 |
|
Homeport Insurance |
52 |
70 |
518 |
5% |
14 |
|
Finish Line Self Insurance Group, Inc |
160 |
263 |
983 |
Fax |
5% |
10 |
City of Santa Monica (CA)* |
99 |
219 |
991 |
7% |
21 |
|
Packard Claims Administration |
311 |
765 |
4,199 |
Fax |
7% |
19 |
Risico Claims Management, Inc. |
242 |
875 |
3,268 |
Fax |
8% |
14 |
PMA Companies |
697 |
1,790 |
9,010 |
Fax |
9% |
14 |
ClaimQuest, Inc. |
191 |
306 |
1,610 |
10% |
21 |
|
County of San Bernardino (CA) |
288 |
867 |
4,551 |
Fax |
13% |
24 |
Affirmative |
543 |
2,966 |
16,575 |
14% |
53 |
|
County of Sacramento (CA) |
87 |
300 |
2,120 |
Fax |
14% |
14 |
Anne Arundel County Risk Management (MD) |
5 |
154 |
1,589 |
Fax |
32% |
28 |
biBERK |
189 |
203 |
1,279 |
Fax |
33% |
60 |
Infinity Risk Management Group |
98 |
113 |
499 |
35% |
61 |
|
Total Bill Count |
63,414 |
*JT2 Integrated Resources began accepting e-bills as of 12/1/2023; the City of Santa Monica began accepting e-bills as of 4/1/2024.
Tracking and publicizing duplicate bill submissions is another way daisyBill uses verifiable data to hold claims administrators accountable and offer a useful snapshot of the industry for all stakeholders. daisyBill clients and non-clients alike are free to use the Directory, and to contact our experts via chat (in the pink circle at the bottom right of this page) or email (at info@daisybill.com).
Nationwide, daisyBill increases revenue and decreases hassle for providers who treat injured workers. Get a free demonstration below.
SCHEDULE DEMO

.gif)


DaisyBill provides content as an insightful service to its readers and clients. It does not offer legal advice and cannot guarantee the accuracy or suitability of its content for a particular purpose.